PIXet Basic
Introduction
The PIXet Basic is minimalist option of the Pixet Pro, intended to be used only with the MiniPIX-EDU device.
Pixet Basic Interface Description
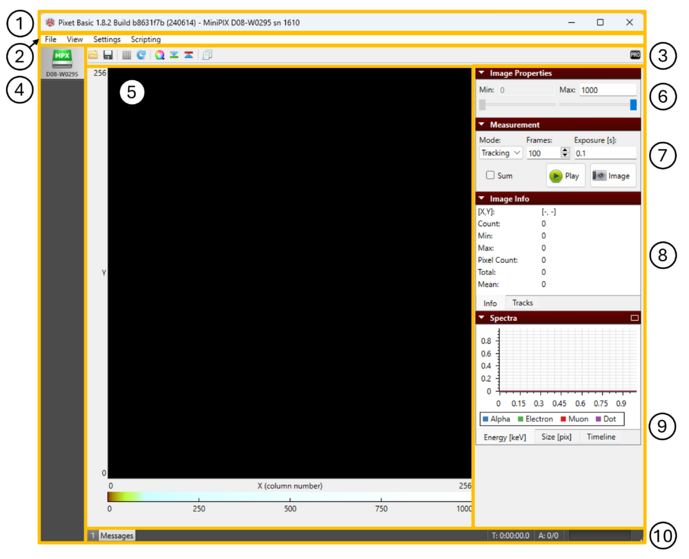
Title bar
"Pixet Basic", {Pixet vesion}, "Build" {build_version}, (release date), "MiniPIX", {Chip ID}, "sn" {serial_number}
Menu bar
File
- Open frame…
- Opens a dialog that allows to open previously recorded frame files using a *.dsc file
- Save data…
- Opens a dialog that allows to save current frame in various file formats
Relevant file formats: .txt, .clog, .png, .tif, .tiff
- Load factory config
- Looks into (Pixet_folder)\factory\ and searches for MiniPIX-{chip_ID}.xml and configures the device by it.
View
- Mirror Image
- Toggle option, allows to display the detector window mirrored along Y axis
- Rotate image
- alows to rotate displayed data in detector window by 90°, 180° or 270° clockwise
- Show grid
- Toggle option, allows to display an overlay in detector window showing the pixel grid
- Ensure aspect ratio
- toggle option, keeps aspect ratio constant when resizing the Pixet window
Settings
- Change password for Pixet Pro
- internal development option
Scripting
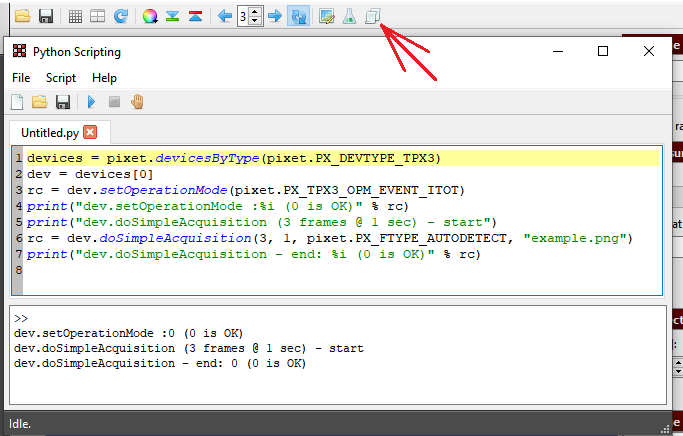
(Menu Scripting, or click on the icon with two papers at the toolbar.)
|
|
|
Quick access toolbar
Open frame… - see File --> Open frame…
Save data… - see File --> Save data…
Show grid - see View --> Show grid
Rotate clockwise - see View --> Rotate image
- Color scheme
- Allows selection of different colour representation for the measured data
- Under warning
- Toggle option, highlights pixels below min value in green
- Over warning
- Toggle option, highlights pixels above max value in red
- Python scripting
- see scripting --> Python scripting
- Switch to PRO button
- developer option, allows to switch to PRO version
Device list column
displays all currently connected devices (their type and chip ID)
Image panel
shows results of current measurement. Color scheme below the window can be changed using the color scheme icon. Slider at the bottom of the screen allows to browse different frames (if there are any).
Right panels
Image properties
allows to set min and max values for view of the current measurement
Measurement
| Mode |
Imaging - measures number of hits in each pixel during selected time period |
| Frames | set how many frames will be measured |
| Exposure [s] | set the exposure duration of each frame |
| Sum | if checked, sums all measured frames in the detector window |
| Play | starts the measurement. Automatically repeats when finished |
| Image | takes a single image with selected exposure time |
Image Info
| [X,Y] | gives X,Y coordinates of selected pixel or pixel under the mouse pointer |
| Count | gives number of hits in selected pixel or pixel under the mouse pointer |
| Min | min number of hits in image or selected area |
| Max | max number of hits in image or selected area |
| Pixel count | number of hit pixels in image or selected area |
| Total | total number of hits in image or selected area |
| Mean | mean number of hits in image or selected area |
Histogram
(only if imaging mode is selected)
Spectra
(only if tracking mode is selected) Energy [keV]
Size [pix]
Timeline
Status bar
| Messages | shows system messages. Broom icon = clear log. Toggle option to automatically open when new message |
| T | duration of current experiment |
| A | current/total no. of measurements. Does not work when repeating or when taking single images |
| Measurement progress bar | Shows progress of current measurement. Does not work when repeating or when taking single images |
Getting started with the PIXet Basic
Quick intro to using the Pixet Basic program. For the Experiments cookbook, see: EDU Kit experiments cookbook
Collecting Data
| 1. Connect the MiniPIX EDU camera, wait for 10 seconds and launch the software Pixet Basic. | |
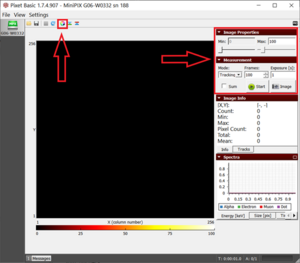
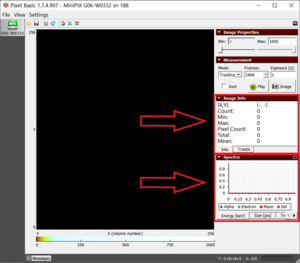
| 2. The settings supposed to be modified while performing the experiments. See right image: The two arrows show the only place to modify the settings. |
|
| 3. The collected visual data will be displayed on the black screen and the additional data (counts, histograms, etc.) is displayed in the two sections- Image Info and Spectra. See right image: The data of the experiment will be displayed in the two sections |
|
| 4. The image info shows energy in the “Info” tab and counts of individual particles in the “Tracks” tab. | |
| 5. The spectra section shows the energy, size, and time of individual particles in respective tabs. Note: To enlarge the spectra results, click on the rectangle at the top right corner of the spectra window. |
Exporting Data
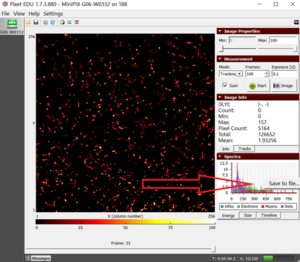
| 1. Select the energy graph in spectra and right-click on the histogram in the spectra section and click on Save to File. | |
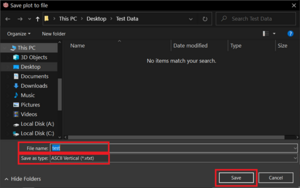
| 2. Enter the file name and select ASCII Vertical in Save as type drop-down menu. Click on Save. | |
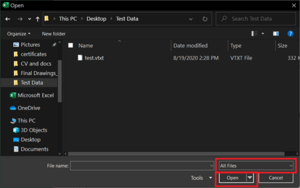
| 3. Next open Excel. Click on Open > Browse and browse to the saved file. Select All Files from the drop-down menu next to the File name field, select the file and click open. | |
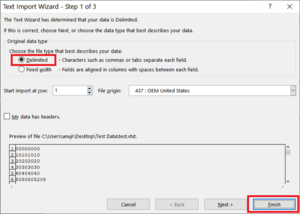
| 4. Select Delimited in the Text Import Wizard window and click on Finish. | |
| 5. The first two columns of sheet are the list of the energy of alpha particles, the next two columns are for electrons, the next two are muons and the last two are dots. | |
| 6. Now select the first two columns and click on the Insert menu. In the Charts section, click on the Scatter chart and select Scatter with Straight Lines to get the histogram. |
