Before Start the Experiments
Possible exceptions in result
- The household accessories used are mentioned in the experiments along with the brand. Using a different brand might affect the results.
- You may sometimes observe long streaks of muons along with other particles. They are completely random and are usually the result of cosmic showers. You will learn more about the particles in one of the experiments.
- The half-life of Po-210 is 138 days. Thus, you will observe change in radioactivity almost every semester.
- If using 241Am instead of 210Po, you will also see 60 keV X-ray peak, biggest than the alpha peak.
- The background radiation might vary with location. For eg., many cities and towns in Colorado are at an elevation of 9000 ft and higher, where they will experience much more background radiation.
Warnings for ionizing radiation Sources
- Do not expose yourself directly to the radioactive sources.
- Keep the sources in the box provided when not in use.
- Never touch the exposed Polonium-210.
- Never try to extract the radioactive material from discs.
- The guiding principle of radiation safety is ALARA = “as low as reasonably achievable”. This principle means that even if it is a small dose, if receiving that dose has no direct benefit, you should try to avoid it. To do this, you can use three basic protective measures in radiation safety:
|
Time simply refers to the amount of time you spend near a radioactive source. Minimize your time near a radioactive source to only what it takes to get the job done. If you are in an area where radiation levels are elevated, complete your work as quickly as possible, and then leave the area. There is no reason to spend more time around it than necessary.
|
|
Distance refers to how close you are to a radioactive source. Maximize your distance from a radioactive source as much as you can. This is an easy way to protect yourself because distance and dose are inversely related. If you increase your distance, you decrease your dose.
|
|
To shield yourself from a radiation source, you need to put something between you and the radiation source. The most effective shielding will depend on what kind of radiation the source is emitting. Some radionuclides emit more than one kind of radiation.
|
Warning for Camera (Detector)
- Do not touch or try clean the sensor surface under any circumstances.
- Do not expose to water or moisture.
- Do not disassemble. The wire-bonding connection may be irreversibly damaged.
- Mechanical damage to wire bonds is not covered by the warranty.
- Do not insert any object into the sensor window.
- The maximum USB cable length is 3m.
Disposal
Do not dispose of unsorted municipal waste. Please use a separate collection facility to contact the supplier from which the instrument was purchased. Please make sure discarded electrical waste is properly recycled to reduce environmental impact
Hardware introduction
Parts need for the experiments
Parts of the EDU-Kit
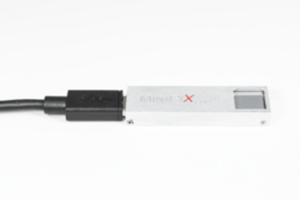
- MiniPIX-EDU
- USB-A extension cable
- EDU-Kit mechanics
- Collimator
Small radioactive sources
- Polonium 210Po in plastic disc (or Ameritium 241Am)
- Strontium 90Sr in plastic disc
- Cobalt 60Co in plastic disc
- Thoriated welding electrodes containing 232Th
Other parts
- 500 ml beaker, high version, or another one high enough so that the water level can be above the level of the sensor installed in the mechanics.
- Piece of paper, sticky note for example
- Thin plastic film, like as food wrapping foil (Saran wrap)
- Piece of bath tissue paper (Brady ultra softone) or other thick paper
- Aluminum foil 22µm (Reynolds wrap standard)
|
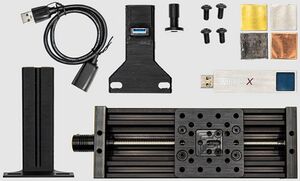 All parts of the EDU-kit set |
Assembling experimental setups
There are three ways to set up the kit as per the experiments:
Using a disc source
|
|
|
Using a disc source with the collimator
|
|
|
Using a thoriated electrodes
|
|
|
Demonstration of thoriated electrode activity
Equipment
Stage, camera holder, electrode holder, thoriated electrodes (~2% of thorium-232), Minipix-EDU
Procedure
- 1. Mount the MiniPix EDU camera and the thoriated electrode on the stage, as shown in the figure.
- 2. Connect the camera to the computer.
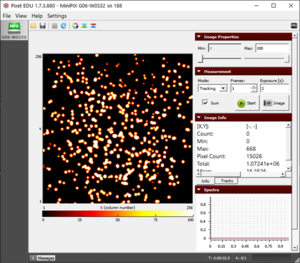
- 3. Launch the Pixet Basic software and modify settings to the following:
- Min Level: 0
- Max Level: 50
- Measurement Mode: Tracking
- Frames: 100
- Exposure: 1 s
- Sum: check
- Color Map: Hot
- 4. Keep the camera and the source as close as possible.
- 5. Click on the play button.
|
|
Results
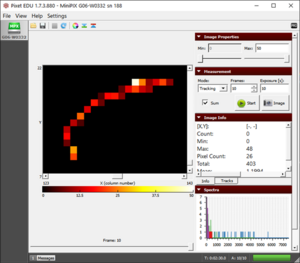
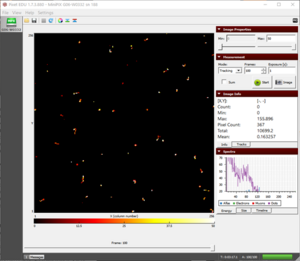
- We observe three different types of tracks, as shown in "The radioactivity" figure.
- The rarest ones are the round blobs (see "alpha" fig in next chapter), caused by the impact of alpha particles.
- The worm-like structures (see "beta" fig in next chapter) are the result of beta radiation.
- The third type of radiation is gamma radiation, which usually leaves a single-pixel or double-pixel large track (see "gamma" fig in next chapter). Sometimes beta radiation might also leave such traces but then the energy of the pixel can be used to differentiate between them.
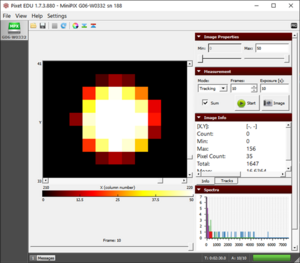
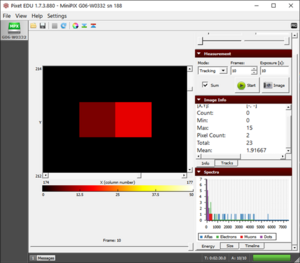
- Draw a rectangle around the individual alpha blob or gamma pixel to determine the energy of the individual particles (fig. "Drawing a rectangle"). The “Total” field in Image Info will show the energy in the rectangle.
|
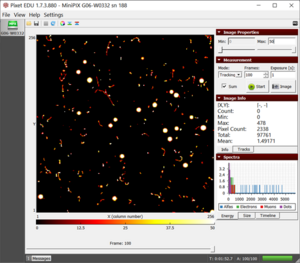 The radioactivity from thoriated electrodes showing all the three types of radiation- alpha, beta, and gamma 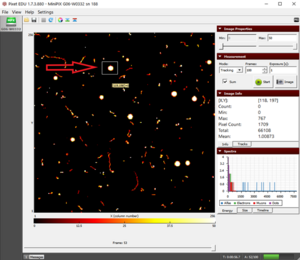 Drawing a rectangle around the individual particle to determine its energy |
Conclusion
- The difference between the tracks of the three radiation is due to the way they interact with the camera.
- Alpha particles (see fig.) being the heaviest, are more ionizing and quickly lose their energy, thus having a short mean linear range.
- For eg. in figure "The redioactivity", the average energy of the alpha particles is 3000 keV which corresponds to the mean range of 9.33 µm in silicon. The generation of free electrons and holes at the surface of the silicon sensor (300 µm) initiate a motion of free charge to the electrodes. During such motion, the holes penetrate multiple adjacent pixels due to diffusion which results in the formation of round blobs. From the color layout of blobs, we can see that the energy absorbed at the center is higher than the edges.
- However, in beta radiation (see fig.), the electron gradually loses its energy due to collisions with electrons in silicon atoms and ionizes them. This causes a signal in neighboring pixels and the result is a curved trajectory of high energy electrons.
- Gamma radiation (see fig) are photons with energy of units to tens of keV. The interaction of this photon and silicon atom releases an electron. The energy of such an electron is very low and is detected as a measurable signal by one, two, or three pixels.
|
 An individual alpha particle blob along with its information shown in Image Info |
 An individual beta particle along with its information shown in Image Info |
 An individual gamma photon along with its information shown in Image Info |
Demonstration of polonium activity
Equipment
Stage, camera holder, source holder, polonium-210, Minipix-EDU
Procedure
- 1. Mount the MiniPix EDU camera and polonium on the stage.
- 2. Connect the camera to the computer.
- 3. Launch the Pixet Basic software and modify settings to the following:
- Min Level: 0
- Max Level: 50
- Measurement Mode: Tracking
- Frames: 100
- Exposure: 1 s
- Sum: uncheck
- Color Map: Hot
- 4. Keep the camera and the source approximately 2 cm away.
- 5. Click on the play button.
|
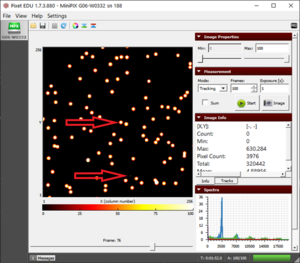 The alpha particle blobs and some gamma photons |
Results
- We observe two different types of tracks, as shown in figure "alpha and some gamma".
- We have an abundance of blobs of alpha particles and some pixels of gamma particles.
- Polonium does not emit any beta radiation but sometimes the background radiation can result in some beta tracks as well.
Conclusion
- We observe large alpha particle blobs and the energy absorbed is also relatively higher (3000 keV to 4000 keV) compared to other sources that we will see in upcoming experiments.
- The energy of small tracks of gamma particles usually does not exceed 20 keV.
Demonstration of strontium activity
Equipment
Stage, camera holder, source holder, strontium-90, Minipix-EDU
Procedure
- 1. Mount the MiniPix EDU camera and strontium on the stage.
- 2. Connect the camera to the computer.
- 3. Launch the Pixet Basic software and modify settings to the following:
- Min Level: 0
- Max Level: 50
- Measurement Mode: Tracking
- Frames: 100
- Exposure: 1 s
- Sum: uncheck
- Color Map: Hot
- 4. Keep the camera and the source approximately 2 cm away.
- 5. Click on the play button.
Results
- We observe tracks of worm-like tracks which is a result of beta radiation (see fig).
- Sometimes we might also observe alpha and/or gamma particles from background radiation.
Conclusion
- The beta particles usually have an energy range from a few keV to hundreds of keV.
- The dots in the result are sometimes the low energy beta particles which do not have enough energy to interact with electrons of silicon and form a long track.
|
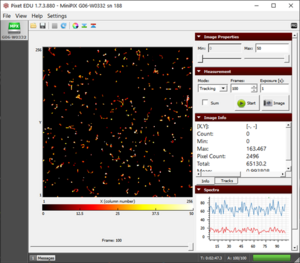 The beta particles during 100 seconds of exposure of strontium-90 |
Demonstration of cobalt activity
Equipment
Stage, camera holder, source holder, cobalt-60, Minipix-EDU
Procedure
- 1. Mount the MiniPix EDU camera and the holder with cobalt on the stage.
- 2. Connect the camera to the computer.
- 3. Launch the Pixet Basic software and modify settings to the following:
- Min Level: 0
- Max Level: 50
- Measurement Mode: Tracking
- Frames: 100
- Exposure: 1 s
- Sum: uncheck
- Color Map: Hot
- 4. Keep the camera and the source approximately 2 cm away.
- 5. Click on the play button.
Results
- We observe a combination of beta and gamma radiation as shown in figure.
- In rare cases, sometimes the background radiation might result in some alpha particles.
Conclusion
- The beta particles, as discussed earlier, have a range of energy from a few keV to hundreds of keV.
- The energy of small tracks of gamma particles usually does not exceed 20 keV.
|
 The tracks of beta and gamma radiation from Co-60 after 100 seconds of exposure |
Measuring background radiation
Equipment
Stage, camera holder, Minipix-EDU
Procedure
- 1. Mount the MiniPix EDU camera and the holder with cobalt on the stage.
- 2. Connect the camera to the computer.
- 3. Launch the Pixet Basic software and modify settings to the following:
- Min Level: 0
- Max Level: 100
- Measurement Mode: Tracking
- Frames: 1800
- Exposure: 1 s
- Sum: check
- Color Map: Hot
- 4. Since background radiation is the measure of ionizing radiation in the environment, thus we do not need the radiation source.
- 5. Click on the Play button.
Results
- Usually, we will observe the beta and gamma radiation but sometimes alpha particles might also be observed like as the figure.
- The more frames you collect, the better is the chance of spotting rare background radiation like muons and alpha particles.
Conclusion
- We are always exposed to radiation from surroundings and they are not always harmful.
- Most of the background radiation comes from radon gas which is formed naturally when radioactive metals, like uranium, thorium, or radium, break down.
- These metals are present in rocks, soil, and groundwater. We are exposed to radon primarily by breathing it in.
|
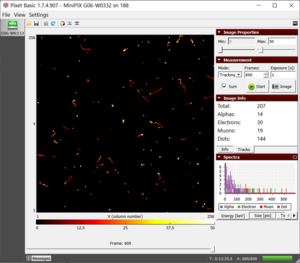 The background radiation collected during 10 minutes scan |
Does microwaving food make it radioactive?
Equipment
Stage, camera holder, beaker, Minipix-EDU
Procedure
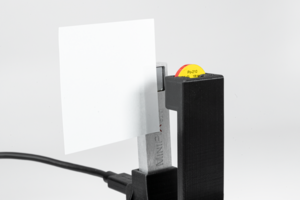
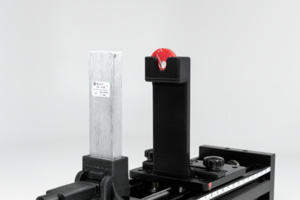
- 1. Mount the MiniPix EDU camera and setup by the figure, using a beaker with fresh water. Making sure the water in the beaker is at least reaching the height of the sensor.
- 2. Launch the Pixet Basic software and modify settings to the following:
- Min Level: 0
- Max Level: 100
- Measurement Mode: Tracking
- Frames: 1800
- Exposure: 1 s
- Sum: check
- Color Map: Hot
- 3. Click on the play button to collect initial radiation. Collect two such datasets. It will be called F1 and F2.
- 4. Now microwave the beaker with water for 5 minutes and put it back on the platform.
- 5. Click on the play button. Collect two datasets of this as well. It will be called M1 and M2.
|
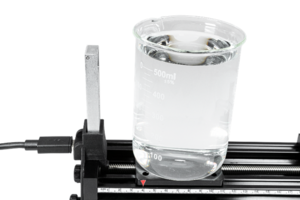 The beaker filled with fresh/microwaved water, placed onto the platform. |
Results
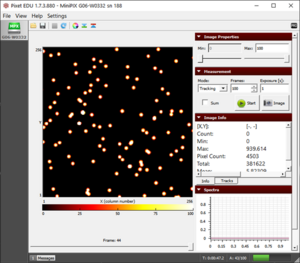
- 1. We observe muons, alpha, beta, and gamma particles in our initial radiation scan, as shown in figures F1 and F2.
|
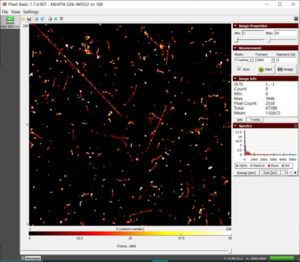 F1 dataset of initial radiation with a total energy of 67288 keV
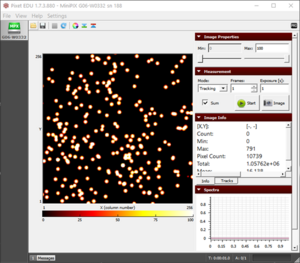
|
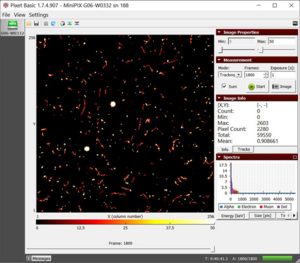 F1 dataset of initial radiation with a total energy of 59550 keV |
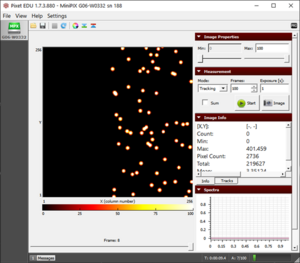
- 2. The remaining two datasets collected with microwaved water on the platform give similar results (M1 and M2).
|
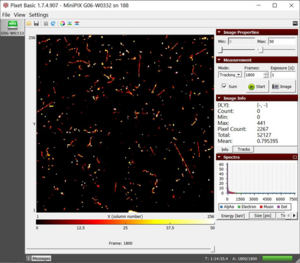 M1 dataset of radiation from microwaved water with a total energy of 52127 keV
|
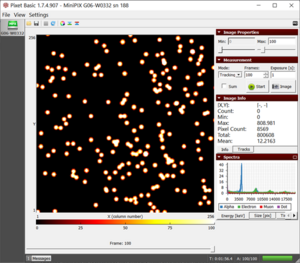
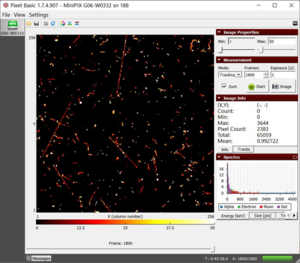 M2 dataset of radiation from microwaved water with a total energy of 65059keV |
Conclusion
- The total energy is within the range of 50,000 keV to 70,000 keV, with or without, fresh or microwaved water, on the platform. Thus we can conclude that microwaving the water did not ionize it.
- The total energy of background radiation depends on the type of radiation observed. Sometimes you may observe higher total energy because of the presence of high energy muons and alpha particles.
How far can alpha particles travel?
Equipment
Stage, camera holder, source holder, polonium-210, Minipix-EDU
Procedure
- 1. Mount the MiniPix EDU camera and the holder with polonium on the stage.
- 2. Connect the camera to the computer.
- 3. Launch the Pixet Basic software and modify settings to the following:
- Min Level: 0
- Max Level: 100
- Measurement Mode: Tracking
- Frames: 100
- Exposure: 1 s
- Sum: uncheck
- Color Map: Hot
- 4. Keep the camera and the source as close as possible and click on the play button.
- 5. Next, shift the source to 2 cm and collect the data. Similarly, collect the data for 3 cm and 4 cm.
Results
- Initially, when the source is closest, we observe that the frame is full of alpha particles (Fig. 1).
- As we reach ~2 cm, the number of observed particles has dropped. Also, the particles are relatively smaller (Fig. 2) which indicates further energy loss because of increased distance of the source from the camera.
- At 3 cm, we observe a further decrease in the size and density of observed alpha particles (Fig. 3).
- Approximately at 4 cm, the alpha particles are much smaller (Fig. 4) and if we further increase the distance to 4.5 cm, they disappear.
Conclusion
- As explained earlier, alpha particles are the heaviest among the three and are more ionizing. They quickly lose their energy in the air and thus have a very short mean linear range.
- The alpha particles from polonium-210 have only ~4.5 cm of range.
|
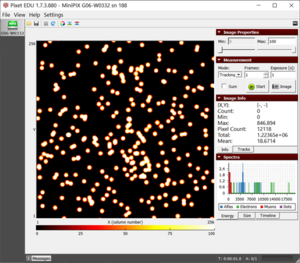 Figure 1. The blobs of the alpha particle from Po-210 with the camera and source kept as close as possible. 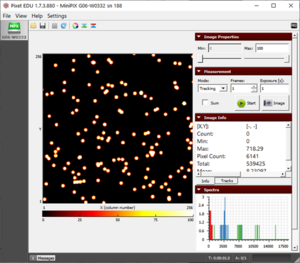 Figure 2. The alpha particle blobs getting smaller at a 1 cm distance between the source and the camera 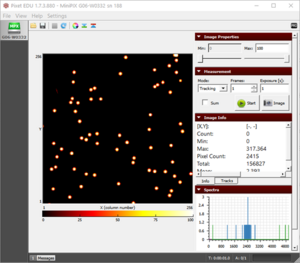 Figure 3. The alpha particle blobs further getting smaller with increasing distance 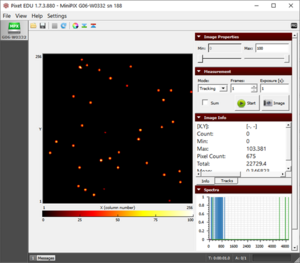 Figure 4. The alpha particles losing most of their energy and almost diminishing at a distance of 4 cm |
Alpha particles being blocked by a paper
Equipment
Stage, camera holder, source holder, polonium-210 , paper, Minipix-EDU
Procedure
- 1. Mount the MiniPix EDU camera and the holder with polonium on the stage.
- 2. Keep the camera and the source 1.5 cm apart and click on the play button.
- 3. Connect the camera to the computer.
- 4. Launch the Pixet Basic software and modify settings to the following:
- Min Level: 0
- Max Level: 100
- Measurement Mode: Tracking
- Frames: 100
- Exposure: 1 s
- Sum: uncheck
- Color Map: Hot
- 5. During the experiment cover half of the camera sensor with paper, as shown in the figure.
- CAUTION: Make sure that paper does not touch the sensor of the camera
- 6. Click on the play button.
|
 Sticky note being used to cover half of the camera sensor. |
Results
- Initially, we observe that the frame is full of alpha particles (first fig.).
- After covering half of the camera sensor with paper, the alpha particles disappeared from the half-covered frame showing that the alpha particles can be blocked by a piece of paper (second fig.).
|
 The alpha particles directly from Po-210 being detected by the camera
|
 The alpha particles being blocked by a piece of paper |
Conclusion
- The alpha particles being the heaviest, lose the energy quickly and thus have a very small linear range which decreases after a denser material like paper comes in the way.
- Although, we still observe the gamma photons on the frame where the alpha particles have disappeared. This is because gamma photons have more penetrating power because they have no charge and thus do not interact with the matter as much as other particles.
- Sometimes, if the piece of paper is thin enough and the source and camera are very close, the alpha particles can pierce through the paper too. Try using different materials like polythene bags, tissue paper, paper napkin, etc.
Alpha particles interaction with plastic film
Equipment
Stage, camera holder, source holder, polonium-210, plastic film (Saran wrap), Minipix-EDU
Procedure
- 1. Mount the MiniPix EDU camera and the holder with polonium on the stage.
- 2. Connect the camera to the computer.
- 3. Launch the Pixet Basic software and modify settings to the following:
- Min Level: 0
- Max Level: 100
- Measurement Mode: Tracking
- Frames: 1
- Exposure: 1 s
- Sum: uncheck
- Color Map: Hot
- 4. Keep the camera and the source as close as possible.
- 5. Click on the play button.
- 6. Next, wrap the polonium disc in plastic film and collect the data again, as shown in the figure.
|
 The polonium disc wrapped in a single layer of plastic film. |
Results
- Initially, we observe that the frame is full of alpha particle blobs as expected (left fig.).
- The size of alpha particle blobs decreases when the plastic film is blocking the path of alpha particles (right fig.).
- Ultimately, with 2 or more layers of foil, all the alpha particles are absorbed in the film and we do not observe any blobs.
|
 The observed alpha particles without anything between the camera and source
|
 The small-sized alpha particles blobs observed when a single layer of plastic film is blocking the path of alpha particles |
- Note: Depending on the exact composition and thickness of the film, the particle decreasing may be greater or less than what you see here.
Conclusion
- A single layer foil was neither thick nor dense enough to stop the alpha radiation.
- Although, two layers of foil absorbed all the energy of the alpha particles. But again we observe that the gamma photons were easily able to penetrate through.
Beam collimation of alpha particles
Equipment
Stage, camera holder, source holder, collimator, polonium-210, Minipix-EDU
Procedure
- 1. Mount the MiniPix EDU camera and polonium on the Stage. Make sure to put polonium in the rear slot and then insert the collimator.
- 2. Connect the camera to the computer.
- 3. Launch the Pixet Basic software and modify settings to the following:
- Min Level: 0
- Max Level: 50
- Measurement Mode: Tracking
- Frames: 100
- Exposure: 1 s
- Sum: check
- Color Map: Hot
- 4. Keep the camera and the source approximately 2.5 cm away. Caution: Make sure that the collimator does not touch the sensor.
- 5. Click on the play button.
|
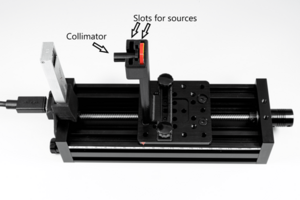 The particle colimation setup |
Results
- We observe a circular image of concentrated alpha particles (Fig. 1).
- We can determine the diameter of the circle hovering the cursor to the two extreme opposite ends of the circle. Making sure the y-coordinate for the two points are the same, subtract the x- coordinate of one point from another as shown in figure 2(a) and 2(b). 221- 98 = 123 pixels
- The difference gives us the number of pixels and since each pixel is 55 µm x 55 µm, the diameter will be 123 x 55 = 6765 µm = 6.76 mm
- The diameter of the collimator is 6 mm and that of the observed circle of alpha particles is 6.76 mm. The error is ~12.7% which is quite low and it can be reduced if we further decrease the distance between the collimator and camera.
- The data collected with the minimum distance resulted in only 1.7% of error.
Caution: It is not advisable to perform the scan at less than 2.5 cm distance because there is a high risk of hitting the collimator into the camera sensor.
Conclusion
- The observed circle of alpha particles is proof of the linear propagation of particles.
- Also, the increase in diameter is proof of the linear divergent beam of alpha particles.
|
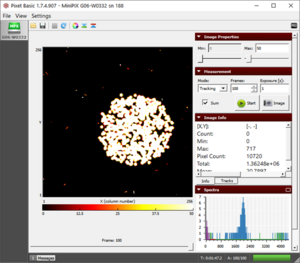 Figure 1. The collimated beam of alpha particles from polonium-210 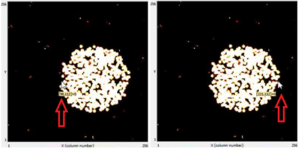 a) x-coordinate of the left corner b) x-coordinate of the right corner'Figure 2. Hovering the cursor to measure the diameter |
Determining the Energy of Alpha Particles
Equipment
Stage, camera holder, source holder, polonium-210, Minipix-EDU
Procedure
- 1. Mount the MiniPix EDU camera and polonium on the stage.
- 2. Connect the camera to the computer.
- 3. Launch the Pixet Basic software and modify settings to the following:
- Min Level: 0
- Max Level: 100
- Measurement Mode: Tracking
- Frames: 100
- Exposure: 1 s
- Sum: uncheck
- Color Map: Hot
- 4. Keep the camera and the source as close as possible.
- 5. Click on the play button.
- 6. Repeat the same experiment with the distance between the camera and source to be 2 cm and 3 cm.
Results
- We observe the alpha particles in the image section.
- For the closest distance, in the energy tab of the Spectra window, we can see the graph between counts and energy of alpha particles. We observe a peak at 4210 keV. (Fig. 1)
- We may use the scroll button to focus on the peak and get the exact energy or increase the size of the spectra window by clicking on the rectangle at the top right corner of the spectra window.
- We also observe that with increasing distance between the camera and the source, the peak shifts towards lower energy, from 4210 keV to 3550 keV to 2550 keV, as shown in figure 2.
- There is another small alpha peak at 8800 keV when the camera and source are closest, as shown in figure 3.
Conclusion
- The average energy of alpha particles is 5500 keV but the observed energy (4210 keV) is less than the energy of alpha particles. This is because of the loss of energy in the air by ionization and part of the energy is also lost in the source itself (the radiation which comes from the inner depth of the source)
- The small peak observed at 8800 keV (fig. 3) is most probably because of two or more particles striking the camera at the same pixel, at the same time. If the exposure time or frame time is increased, we will observe more overlapping particles and thus will increase the 8800 keV peak.
- Some of the particles that strike the edges of the camera (Fig []) are not able to register their full energy and thus are detected as low energy particles. More information can be found in the experiment showing how collimator effects the detected energy.
|
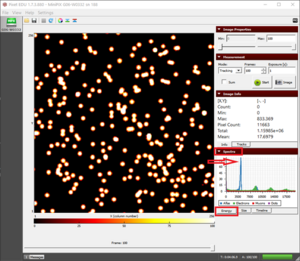 Figure 1. The energy peak of alpha particles. The higher the exposure time, the more counts we observe. 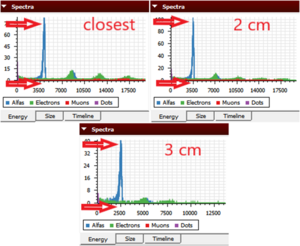 Figure 2. The three different energy peaks observed for three different distances. 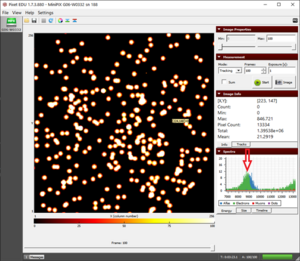 Figure 3. A smaller peak observed at almost twice the energy of alpha particles which is the result of two alpha particles striking the same pixel at the same moment. |
Effect of collimator on the detected energy of alpha particles
Equipment
Stage, camera holder, source holder, collimator, polonium-210, Minipix-EDU
Procedure
- 1. Mount the MiniPix EDU camera and polonium on the Stage. Make sure to put polonium in the rear slot and then insert the collimator.
- 2. Connect the camera to the computer.
- 3. Launch the Pixet Basic software and modify settings to the following:
- Min Level: 0
- Max Level: 100
- Measurement Mode: Tracking
- Frames: 600
- Exposure: 1 s
- Sum: check
- Color Map: Hot
- 4. Keep the camera and the source approximately 2.5 cm away.
- 5. Click on the play button.
- 4. Set the distance to ~2.5 cm. Caution: Make sure that the collimator does not touch the sensor.
- 5. Click on the play button.
- 6. Save the energy histogram as ASCII Vertical (*.vtxt) format (explained in Introduction of Pixet Basic Software).
- 7. Repeat the same experiment without the collimator and make sure that the distance does not change and save the histogram for this as well.
- 8. Now export the results into excel (explained in Introduction of Pixet Basic Software) and plot the curve between energy and counts of alpha particles.
|
The particle colimation setup |
Results
- Both the graphs have a similar pattern, with the peak almost at the same point. But once you overlay the two graphs, we observe that the experiment with the collimator has a much smaller peak (see fig.).
- This is because the radiation from the source is a divergent beam and a lot of energy is absorbed or blocked by the collimator itself.
- Another observation is the decrease in the counts of low energy particles in the experiment with the collimator (Fig. 2). Or we can say that the peak is wider without the collimator
Conclusion
- The experiment without a collimator has many alpha particles hitting the edges of the camera and thus does not register all of their energy.
- This increases the count of low energy particles.
- The collimation decreases the particles striking the edges of the camera and thus have a flattening curve at lower energy.
|
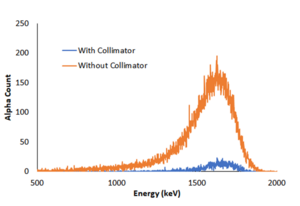 The alpha energy peak from Po-210 both with and without collimator |
Different type of energy spectrum of alpha particles
Equipment
Stage, camera holder, source holder, bath tissue (Brady ultra softone), plastic film (Saran wrap), polonium-210, Minipix-EDU
Procedure
- 1. Mount the MiniPix EDU camera and polonium on the Stage.
- 2. Connect the camera to the computer.
- 3. Launch the Pixet Basic software and modify settings to the following:
- Min Level: 0
- Max Level: 100
- Measurement Mode: Tracking
- Frames: 100
- Exposure: 1 s
- Sum: check
- Color Map: Hot
- 4. Keep the source and camera as close as possible with the tissue between them, as shown in figure 1.
- 5. Click on the play button.
- 6. Repeat the same experiment with a layer of plastic film in place of tissue.
Results
- The peak that we observe in the case of food wrapping foil is at ~2200 keV and the spectrum looks similar to the one when nothing is blocking the path of alpha particles (Fig. 2).
- But the spectrum of tissue looks very different and we observe a wide range of energies from 0 keV to 3500 keV, instead of a sharp peak (Fig 3).
Conclusion
- The experiment explains the effect of the non-uniform density of blocking material on the flow of alpha particles.
- The foil has an equal distribution of density all around and thus we observe the usual peak with lower energy (some of the energy is being absorbed by the film).
- But in the case of the bath tissue, the probable variation in thickness and its varying porosity at different points results in uneven absorption of energy. Thus, many alpha particles are being stopped and some easily pass through the holes, resulting in the widening of the energy peak.
|
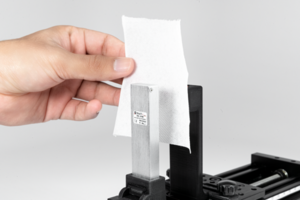 Figure 1. Setup of polonium and camera with tissue paper blocking the path of radiation. 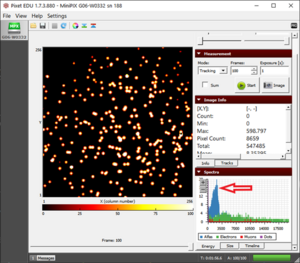 Figure 2. The energy peak of alpha particles being observed at ~2200 keV when the plastic film is blocking the way of alpha particles 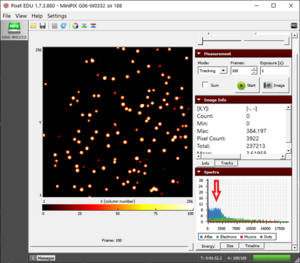 Figure 3. A scattered pattern of energy being observed when the path of alpha particles is blocked by a tissue paper |
Deceleration of alpha particles in plastic food wrapping foil
Equipment
Stage, camera holder, source holder, plastic film (Saran wrap), polonium-210, Minipix-EDU
Procedure
- 1. Mount the MiniPix EDU camera and polonium on the Stage.
- 2. Connect the camera to the computer.
- 3. Launch the Pixet Basic software and modify settings to the following:
- Min Level: 0
- Max Level: 100
- Measurement Mode: Tracking
- Frames: 100
- Exposure: 1 s
- Sum: uncheck
- Color Map: Hot
- 4. Keep the camera and the source as close as possible.
- 5. Click on the play button.
- 6. Repeat the same experiment with a layer of food wrapping foil inserted between the source and the camera.
Results
Velocity of alpha particles
Equipment
Stage, camera holder, source holder, polonium-210, Minipix-EDU
Procedure
- 1. Mount the MiniPix EDU camera and polonium on the Stage.
- 2. Connect the camera to the computer.
- 3. Launch the Pixet Basic software and modify settings to the following:
- Min Level: 0
- Max Level: 100
- Measurement Mode: Tracking
- Frames: 100
- Exposure: 1 s
- Sum: uncheck
- Color Map: Hot
- 4. Keep the camera and the source as close as possible.
- 5. Click on the play button.
- 6. Save the data.
Results
- 1. From the histogram (see fig.), we may observe the energy of alpha particles to be 4210 keV
- 2. The relativistic energy of a particle is given by the following equation:
- E = E0 + Ek
- where E0 (3735000 keV for alpha particles) is rest energy and Ek is the kinetic energy.
- If we substitute
- we get the following equation:
- 3. Another method of calculating the velocity ratio is using the classical equation of kinetic energy:
- 4. Substituting the values in equation 2 and 3, (m = 6.64 x 10⁻²⁷ kg):
|
 The histogram in the spectra section displays the energy of alpha particles from polonium-210 |
Conclusion
- The velocity of alpha particles is 0.0473c or ~5% the speed of light.
- The velocity of an alpha particle is relatively very less than that of light, thus we do not observe any difference in result from relative and classical equations. This might not be the case with beta particles as they travel almost 90% of the speed of light.
- Since the kinetic energy of an alpha particle is significantly smaller than its rest energy, the deviation of classical and relativistic v/c is very small.
Cosmic rays
Equipment
Stage, camera holder, Minipix-EDU
Procedure
- 1. Mount the MiniPix EDU camera to the stage.
- 2. Connect the camera to the computer.
- 3. Launch the Pixet Basic software and modify settings to the following:
- Min Level: 0
- Max Level: 100
- Measurement Mode: Tracking
- Frames: 1800
- Exposure: 1 s
- Sum: check
- Color Map: Hot
- 4. Cosmic rays are always present around us and thus we do not need the radiation source.
- 5. Click on the play button.
- 6. Repeat the same scan with the camera placed flat on the table, as shown in figure 1 or or lying with sensor chip perpendicular to the table. For this purpose, the camera has to be taken off the stage.
- 7. Try View -> Rotate Image for better orientation in the images (zero for orientation as on the figure).
|
 The detector laid flat on the table to collect radiation in a different orientation |
Results
- We observe the usual beta and gamma radiation. The alpha blob coming up in figure 3 should not be related to the orientation of the camera. We may observe alpha particles in any orientation.
- Other than these three particles, when the camera is vertical, we observe some long straight streaks of muons in figure 1.
- Although, by laying the camera flat on the table, the muons suddenly disappears (Fig. 2) or we see only short traces.
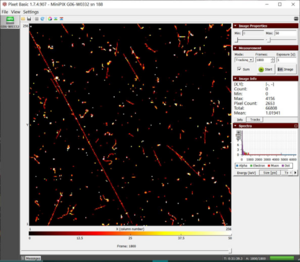 Figure 1. The long streak of muons from cosmic showers when the camera sensor is vertical
|
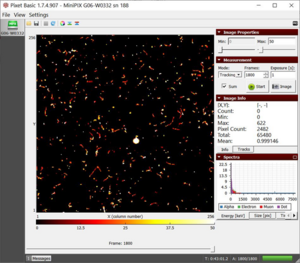 Figure 2. Hardly any muon shows up when the camera is laid flat on the table. We observe the alpha blob from the background radiations.
|
- The number of these tracks in case of vertical position is much higher than the one in a horizontal position of the detector chip.
Conclusion
- These long streaks can only be created by highly penetrating particles moving in the plane of the sensor.
- Since the thickness of the sensor is only 300 µm, it can be concluded that the particle is not coming from a nearby source.
- Most of the streaks are at a range of 45 degrees to 90 degrees of angle with the horizontal plane. So most probably, these particles are coming from right above our head. These can be muons from the secondary shower of cosmic rays.
- These muons are usually generated at a height of approximately 10-20 km above the earth’s surface and move at almost the speed of light but have a very short life span. Due to the high energy, they can be recorded even hundreds of meters underground.
Estimating the thickness of aluminum foil
Equipment
Stage, camera holder, source holder, polonium-210, aluminum foil (Reynolds wrap standard) , Minipix-EDU
Procedure
- 1. Mount the MiniPix EDU camera and polonium wrapped in a single layer of aluminum foil on the stage, as shown in figure 1.
- 2. Connect the camera to the computer.
- 3. Launch the Pixet Basic software and modify settings to the following:
- Min Level: 0
- Max Level: 100
- Measurement Mode: Tracking
- Frames: 600
- Exposure: 1 s
- Sum: check
- Color Map: Hot
- 4. Keep the camera and the source as close as possible.
- 5. Click on the play button.
- Note: Using a heavy-duty foil might alter the results.
- 6. Next, wrap two foils of aluminum and without moving the stage, collect the data again.
|
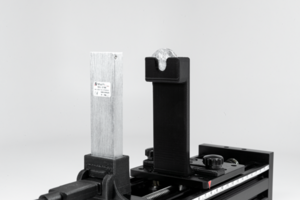 Figure 1. The setup of polonium source wrapped in aluminum foil |
Results
- Initially, we observe some traces of alpha particle blobs (Fig. 2). The muon (a long streak) observed is not because of aluminum foil but is a rare observation which we may have in any experiment we perform. Basically, it is part of background radiation.
- The blobs of alpha particles disappear when two layers of foil are used.
- The mean linear range (R) of alpha particles in the air can be calculated using the following equation:
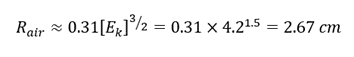 where Ek is the kinetic energy of alpha particles in MeV.
- From the previous experiments, we know that the energy of alpha particles is approximately 4.2 MeV when the source and cameras are placed as close as possible. Thus, considering the Ek to be 4.2 MeV, we will calculate the mean linear range of alpha particles in aluminum (Z=13) using the following formula:
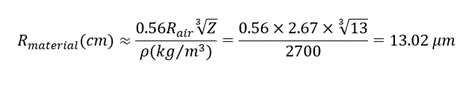 where Z is the atomic number and ⍴ is the density of the substance blocking material (⍴Al = 2700 kg/m3).
|
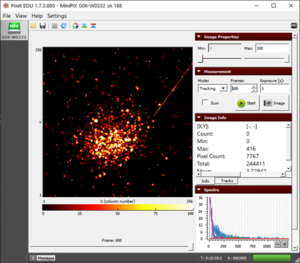 Figure 2. Alpha particles passing through a single layer of aluminum foil |
Conclusion
- Since the alpha particle was able to go through a single layer of foil, that means the foil is thinner than 13.02 µm (Fun fact: Human hair diameter is ≈ 70 µm).
- But, two layers of foil were able to block the alpha particles, which means that the foil is thicker than 6.5 µm. Thus we can conclude that the thickness is within the range of 6.5 µm to 13.02 µm.
Range of gamma photons
Equipment
Stage, camera holder, source holder, cobalt-60, Minipix-EDU
Procedure
- 1. Mount the MiniPix EDU camera and cobalt on the stage.
- 2. Connect the camera to the computer.
- 3. Launch the Pixet Basic software and modify settings to the following:
- Min Level: 0
- Max Level: 100
- Measurement Mode: Tracking
- Frames: 600
- Exposure: 1 s
- Sum: check
- Color Map: Hot
- 4. Keep the camera and the source approximately 2 cm away.
- 5. Make a table for the distance between camera and source (x) and kinetic energy of gamma photons (Ek) like as Table 1.
- 6. Click on the play button to collect the data.
- 7. Repeat the same experiment with distance between camera and source to be 4 cm, 6 cm, 8 cm, 10 cm, and 12 cm.
Results
- 1. Fill the table with the x and Ek values.
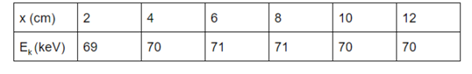
Table 1: The observed energy of gamma photon with increasing distance
- 2. The standard deviation of Ek is 0.82 which is very insignificant compared to the energy loss of alpha particles.
Conclusion
- The photons retain most of their energy until it’s lost in interaction through the photoelectric effect or by creating electron-positron pairs or by Compton scattering.
Bragg Curve
Equipment
Stage, camera holder, source holder, polonium, Minipix-EDU
Procedure
- 1. Mount the MiniPix EDU camera and polonium on the stage.
- 2. Connect the camera to the computer.
- 3. Launch the Pixet Basic software and modify settings to the following:
- Min Level: 0
- Max Level: 100
- Measurement Mode: Tracking
- Frames: 100
- Exposure: 1 s
- Sum: check
- Color Map: Hot
- 4. Keep the camera and the source approximately 1.5 cm away.
- 5. Click on the play button.
- 6. Next, shift the source by 0.3 cm away from the camera and collect the data again. Repeat the process until the energy peak stops showing up.
- 7. Make a table for distance (d) and kinetic energy of alpha particles (Ek) (Table 1)
Results
- We can calculate the linear stopping power (S1) of air using the three-point numeric derivative of kinetic energy (Ek) with respect to distance traveled (d).
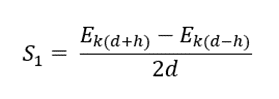
where h = 0.3
- The distance (d), kinetic energy (Ek), and stopping power (S1) is shown in table 1 and figure 1 shows the distance vs stopping power
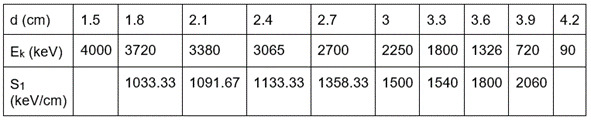
Table 1. Comparison of the kinetic energy of alpha particles (Ek) and stopping power (S1) with distance
- We stopped the measurement at a distance of 4.2 cm because the energy histogram started losing its Gaussian shape.
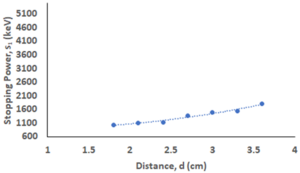
Figure 1. Bragg curve of stopping power of air on alpha particles
Conclusion
- From the table, we observe that the stopping power is increasing with distance.
- Initially, the alpha particle loses its energy in the range of 1000 keV to 1150 keV which jumps to ~1500 keV and it loses ~2000 keV for the last displacement in the experiment.
- Our curve corresponds to the part of Bragg Curve (Fig. 2). Alpha particle loses most of its energy shortly before it stops.
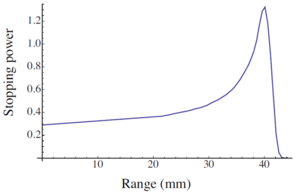
Figure 2. The typical shape of the Bragg curve
- The reason we cannot observe the whole Bragg Curve is that our source is not mono-energetic. This ability of heavy charged particles to pass maximum energy at the very end of its range is utilized in proton or hadron therapy.
Related


