PIXet
Introduction
The PIXet Pro is a multi-platform software developed in ADVACAM company. It is a software package for Medipix family chips for acquisition control. It supports most of the available Medipix based devices (Medipix 2, Medipix3, Timepix, Medipix Quad, Timepix Quad, Widepix, Timepix3) and commonly used readout interfaces MiniPIX, FitPIX, ModuPIX, WidePIX, RasPIX, etc. Pixet provides many tools for optimization of detector parameters, data processing, image corrections and scripting. Pixet has an open architecture (not open source) supporting various types of imaging detectors and related devices (e.g. control of positioning systems or X-ray tubes) and allowing integration of user plug-in modules prepared in C++. Many of such plugins already exists, e.g. Timepix chip equalization, calibration, beam-hardening correction, flat-field correction, particle track analysis, scripting in Python with syntax highlighting. Pixet is written in C++ language and uses multi-platform Qt libraries.
- Instruction video: https://www.youtube.com/watch?v=wT5lcu3m-OU&t=6s&pp=0gcJCYQJAYcqIYzv
Features
- Measures and reads data from Medipix detectors
- Visualizes the measured data
- Configures the detector
- Saves measured data in several formats (ASCII, PNG image, Pixel Log, …)
- Flat-field correction
- Calibration of measured data
- Beam hardening correction
- Cluster Analysis tool
- Multi-platform software (runs on Windows, Mac OS X, Linux)
System Requirements
Operating systems
- Windows 7
- Windows Server 2012
- Windows 8
- Windows 10
- Windows 11
- Mac OS X 10.12 and higher
- Ubuntu Linux
- Debian Linux
- CentOS Linux
- RedHat Linux
Recommended system configuration
- Intel Pentium or equivalent processor with 1.5 GHz or faster
- 8 GB RAM or more
- Graphics mode 1280x800 with 16.7 M colors or higher
- 200 MB free hard disk space (additional space might be required for saving log files, configuration files and measured data)
- USB 2.0, USB 3, or gigabit ethernet port, depending of device type.
Installation
Microsoft Windows
The PIXet for Windows is distributed as a single setup.exe file for automatic installation. For automatic installation just double-click the setup.exe and follow the instruction in the setup wizard.
In order to communicate with most of the devices, the PIXet needs the device drivers to be installed. In newer versions of Microsoft Windows, the drivers are installed automatically when the device is connected the first time. In a case that the drivers are not installed automatically, the drivers installation file Drivers/ is included in the distribution of the PIXet.
- setup.exe - Installer of the FTDI driver - Used for USB2 devices, Minipix for example.
- USB3driver.exe - Installer of the Opal Kelly driver - Used for USB3 devices, Advapix for example.
- cyusb3.inf - Installer of CYP driver - Used for next generation USB3 devices.
Mac OS X
The PIXet for Mac OS X system is distributed as a standard DMG file (disk image file). To install the Pixet, mount (double-click) the pixet.dmg file. A window with the disk content will open. To install, just move the Pixet folder to the Application folder.
There is no need to install a special driver for the devices. The software might ask first time it is launched after a reboot of the computer to unload Apple driver. The Apple driver is not compatible with our devices. Just click on the unload.
Before first run the PIXet, open the system commandline and:
- Type
sudo spctl --master-disableto the commandline and press Enter. - Open System Preferences -> Privacy & Securtiy and set the Allow applications from Anywhere
- Type
sudo spctl --master-enableto the commandline and press Enter.
Linux
The Pixet for Linux system is distributed as a single tar file. To install, just untar the file. The software is launched by executing the pixet.sh script.
There is no need to install a special driver for the devices. In order to run the software under normal user, it is necessary adjust the permissions of our USB devices in udev system. This can be done by executing the script install_driver_rules.sh as root. It is also sometimes necessary to unload the system ftdi_sio driver. Just execute rmmod ftdi_sio as root in shell before running the software.
Main window of PIXet Pro
Note: If a Minipix-EDU used, the Pixet program will switch to the Pixet-EDU mode, where most functions are hidden.
Main window
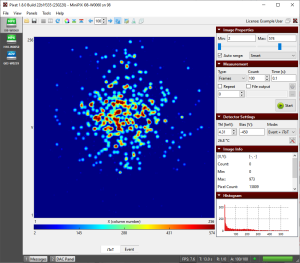
The main window the software consists of device sidebar, frame (picture) panel where measured data are visualized, control panel on the right side, toolbar, menu bar, and status panel in the bottom. The panels on the right side can be minimized by clicking on the down arrow in the corresponding panel or can be hidden/shown via menu Panels.
Device sidebar
The device sidebar shows all the connected devices as icons. By clicking on each icon user can open frame panel and control panels of each device.
Frame panel
The frame panel visualizes measured data (frames).
Note: Many functions controlling the panel are in the toolbar above it.
- Zooming area in the frame: An area in the frame can be zoomed by holding the left mouse button in the frame, dragging the mouse to create a selection rectangle and releasing the mouse button. The area will be zoomed, scrollbars will appear and the X and Y axis will show exact location and size of the zoomed area. The zoomed area can be zoomed further by repeating the steps above.
- Moving zoomed area: The zoomed area can be adjusted by using scrollbars or by dragging the picture with right mouse button.
- Subframes: If the combined/dual mode selected, the device generating more datasets in parallel. It is accesible as the subframes. User can switch it by tabs below the frame panel.
Image Properties panel
This panel allows for adjusting of color range of the frame.
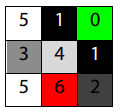
- Min level, Max level Adjusts the minimal and the maximal value of the frame that are visible in the frame panel. The values between Min level and Max level are then mapped to selected color map. In the case of the gray color map, minimal selected value is black and maximal value is white. To illustrate more clearly, let’s imagine we have a frame 3x3 with values as in the picture below and we set Min Level=1 and Max Level=5. The values under 1 (in this case 0) will not be visible and will be shown in lowest color (black). The values over selected range (in this case 6) will be show in the highest color (white). The rest of the values will be mapped to the 256 colors of the gray map, starting with dark colors for lower values and lighter colors for greater values.
- Auto range When the auto range checkbox is checked, the frame panel color range is set automatically according to the selected auto range type:
- Min-Max – the minimum and maximum value in the frame is set as Min Level and Max Level.
- 0.XXX – 0XXX fractile – color range is set according to selected fractile. The fractile is approximately calculated from histogram of the frame with 1024 bins to reduce CPU time. What it means is, that a histogram of the frame values is made (1024 bins) and the values than according to fractile e.g. for 0.01-0.99 the 1% of lowest and highest values in histogram, are set as Min Level and Max Level.
- Smart – Auto range with minority values ignored.
Measurement panel
This panel allows for setting parameters of measurements such as acquisition time, number of frames, output file, etc.
- Type: Type of the measurements – either Frames (single frames), Integral (frames are summed up
into one frame) or Test Pulses (testing of the parameters of the chip. Injects an artificial charge into each pixel to test its functionality, only for experts)
- Count: Sets the number of frames that will be measured to the memory of PC or saved to hard drive.
- Time: Sets the acquisition time (shutter time) of each measured frame in seconds.
- File output: If the checkbox File output is checked and the file name is entered, the measured data will be saved in to this file.
- Repeat: If checked, repeats the measurement of the Frame Count number of frames. This will be repeated several times up to the number in the repeat spin box. If the number is zero, the software will repeat until the repeat checkbox is unchecked or the measurement is stopped.
- More measurement settings (a sprocket icon): Opens a dialog with detail settings of the measurement (triggers, file output, …)
- Start / Abort button: Starts or aborts the measurement.
Detector Settings panel
This panel allows for changing of the parameters of the device.
Note: Different devices can has different list of settings and indicators.
- Threshold: Sets the thresholds of the device in DAC steps or in energy (keV). The threshold determines what energies of particles or radiations will be measured by the detector. The radiation under the threshold will be “ignored” by the device. If the device is properly set up, user can enter the threshold directly in energy [keV]. Otherwise the value represents raw DAC value of the chip. The sense of the raw value for Timepix detector is reversed – smaller value correspond to higher threshold (for positive polarity). If the polarity of the chip is negative, the sense is reversed. Note: If the value is other then default, the converted energy is not correct. The energy calibration is only for default threshold value.
- Bias: Sets the bias voltage for the sensor of the detector.
- Mode: Sets the operating mode of the detector. Different types of detectors have different lists of modes, and some identical modes have different names. Some detectors have combined modes with multiple output data sets at once (ToT+ToA, Event+iToT), others do not have multiple modes at once (Time, Energy).
- Counting, Event – This is an event counting mode. Each event above the threshold increments the counter by 1.
- Energy, ToT – Time over threshold. The counter is incremented continuously as long as the signal is over the threshold. It is used to measure the particle energy.
- iToT – Integrated ToT. Sum ToT for all hits of the pixel. Note: The result converted to energy may be inaccurate due to non-linearity.
- Time, ToA – Time of arrival. The counter is incremented from the moment first hit arrives until the end of the data acquisition.
- Temperature indicator
- Clock: Sets the clock of the Timepix chip. Different detector types has different clock settings or has not this kind of setting. Note: If the changed value has an influence to ToT measurement, the converted energy is not correct. The energy calibration is only for default ToT frequency value.
Filters panel
This panel allows for applying of different filters or corrections to visualization of the measured data. This does not change the measured data, only the visualization in the frame panel.
- Apply filter: When the checkbox is checked, the selected filter is applied to the current frame in the frame panel.
- Filter: Drop down list to select the filter.
- Configure filter: Shows a dialog with parameters and settings of the selected filter.
Image Info panel
This panel shows basic information and statistics of the current frame in the frame panel.
- [X, Y]: Position of the mouse cursor in the frame in frame (device) coordinates
- Count: Value of the pixel in the frame panel the mouse cursor is pointing at
- Min: Minimal pixel value in the current frame
- Max: Maximal pixel value in the current frame
- Pixel Count: Number of active/hit pixels (non-zero pixels)
- Total: Sum of all pixel values in the current frame
- Mean: Mean (average) pixel value in the current frame
Histogram panel
This panel shows histogram of pixel values in the current frame (the x range depends on selected min and max ranges in Image Properties panel)
Menus
- Open Frame: Opens and loads measured data from hard disk into the software.
- Save Measured Data: Saves all the measured frames from the memory to hard drive. User can choose between several file formats to save the frames.
- Save Current Frame: Saves the frame currently visible in the frame panel to file. User can choose between raw ASCII matrix or image format.
- Save All Frames: Saves all the frames in the buffer in the same way as Save Current Frame.
- Load Config: Loads configuration of the detector from file
- Save Config: Saves the current configuration of the detector to configuration file
- Load Factory Config: Loads the factory configuration of the device. The process is:
- 1. Pixet try to find factory configuration file in the "factory" directory and load it.
- The files must has proper name, like as “WidePIX-B04-W0535-10.xml”, “MiniPIX-I10-W0239.xml” for example.
- See: The factory and the configs subdirectories
- 2. If failed, Pixet try to load configuration from internal device memory if the device has it (Minipix yes, Widepix no) and has config in it.
- 3. If failed, an error message occurs.
- 1. Pixet try to find factory configuration file in the "factory" directory and load it.
- Reconnect: If the device was disconnected from the computer, selection this menu item will try to reconnect and reinitialize the device
- Mirror Image: Mirrors horizontally the frame. When the frame is rotated the frame is mirrored according to the rotation.
- Rotate Image: Rotate the frame clockwise by 0, 90, 180 or 270 degrees.
- Show Grid: Shows grid over the frame that highlights borders between pixels of the frame.
- Show Masked Pixels: The pixels that are masked in the pixel matrix configuration are visualized with a special color (e.g. for Gray color map it is the blue color)
User can select which control panels should be visible on the right side of the window
Main tool bar
The icons in the toolbar are described from the left side to the right side.
The toolbar have left-aligned and right-aligned part.
![]()
- Open Frame: Opens and loads measured data from hard disk into the software. The frames can also be opened by dragging and dropping frames on to the frame panel.
- Save Measured Data: Saves all the measured data (frames) from the memory to a hard drive. User can choose between several file formats to save the frames.
- Show Grid: Shows grid over the frame that highlights borders between pixels of the frame.
- Rotate Image: Rotates the frame clockwise by 0, 90, 180 or 270 degrees.
- Color map: In the Color map dropdown box it is possible to selected colors that are used to map values of the frame.
- Under warning, Over warning: This two buttons set if the values under the selected range or over the selected range should be highlighted with special color. For the gray map these are green color (under values) and red color (over values). If we take the same frame 3x3 as above, we get the picture as shown below. The value 0, which is under 1 would be shown in green and the value 6 (above 5) would be red.
- Previous frame: Shows the previous measured frame in memory
- Frame: Shows the frame with selected index
- Next frame: Shows the next measured frame in memory
- Auto update: If enabled every new measured frame is automatically shown in the frame panel. When not enabled, the frames are measured in the memory, but are not shown in the frame panel. To accelerate the measuring of frames from the device, it is recommended to disable this option.
- Edit Pixel Configuration: Shows the pixel configuration toolbar and pixel configuration frames (Mask bits, Test bits, …)
- Measurements: Measurement utilities.
- Python scripting: Runs the integrated Python console. Program can control the Pixet program and use graphic features.
Right-aligned part of the toolbar:
![]()
- License indicator
- Undock: Undocks window of this device.
- Pixet Icon: Drop down icon with additional Pixet menu. From this menu additional plugin modules can be opened and other functions can be launched.
Bottom bar
Left buttons
- Messages: On/Off a panel with error and info messages. The panel displays a messages about the selected device. If an error occurs, it will be displayed automatically.
- DAC Panel: On/Off the DAC panel. This is a tool for very low level settings of the detector chip(s). For special scientific using only. Not need for normal using of the device. Not recommended to change anything here.
Statusbar and progressbar
- Total acquisition time: Shows total time that has passed since starting the measurement.
- Repeat index/ count: Shows the index of current repetition and the total number of repetition that should be measured.
- Acquisition index / count: Shows the index of current measured frame and number of all frames that should be measured.
- Status icon: Shows the status of the device, if it is ready to measure. (Green - OK, Yellow - warning, red - error). Hover the mouse over the icon for more details.
- Progress bar: Shows the total progress of the measurements (not taking into account repeat)
Pixel Configuration toolbar
If the Edit Pixel Configuration button in main toolbar is activated, the Pixel Configuration Toolbar is
shown together with a frame for each pixel adjustment parameter (Mask, Test, THL, Mode, …). The
toolbar allows for changing the pixel configuration matrix.
The icons in the toolbar are described from the left side to the right side.
![]()
- Open Pixel Configuration: Loads the pixel configuration (or part of it) from a file.
- Save Pixel Configuration: Saves the pixel configuration (or part of it) to a file.
- Cursor (No toggling): Clicking with the mouse cursor in the frame panel does not affect the pix. conf.
- Toggle Bit in Pixel: Clicking with the mouse cursor will toggle the mask bit in the pixel if Frame or Mask tab is selected. If the Test tab is selected, clicking will toggle the test bit. For the other tabs it will not do any action.
- Toggle Bits in Column: Same as Toggle Bit in Pixel, but will toggle all the pixels in the selected column
- Toggle Bits in Row: Same as Toggle Bit in Pixel but will toggle all the pixels in the selected row
- Mask All Pixels: Masks all the pixels in the frame
- Unmask All Pixels: Unmasks all the pixels in the frame
- Mask Selection: Masks the pixels in selected area. Selection area is created by dragging the mouse similarly as for zooming the frame but with holding the Ctrl (Command on OS X) key and releasing the mouse button before releasing the key.
- Unmask Selection: Unmask all the pixels in the selected area
- Set Pixels Cfg Bits: Opens a dialog where the user can specify in detail values of pixel configuration bits for selected area.
- Reset Pixel Cfg. Bits: Drop down menu where the selected pixel configuration bit is reset to its default value (depends on chip type).
- Mask Pixels under Value: Mask all the pixels that are counting in the current frame less then specified number
- Mask Pixels over Value: Mask all the pixels that are counting in the current frame more than specified number
- Shift Thl. Adj. For Pixels Under Value: Shifts the THL adjustment bits for each pixel one step for all the pixels in the current frame that are counting less then specified number
- Shift Thl. Adj. For Pixels Over Value: Shifts the THL adjustment bits for each pixel one step for all the pixels in the current frame that are counting more than specified number
Dialogs of Main window
Measurement Settings dialog
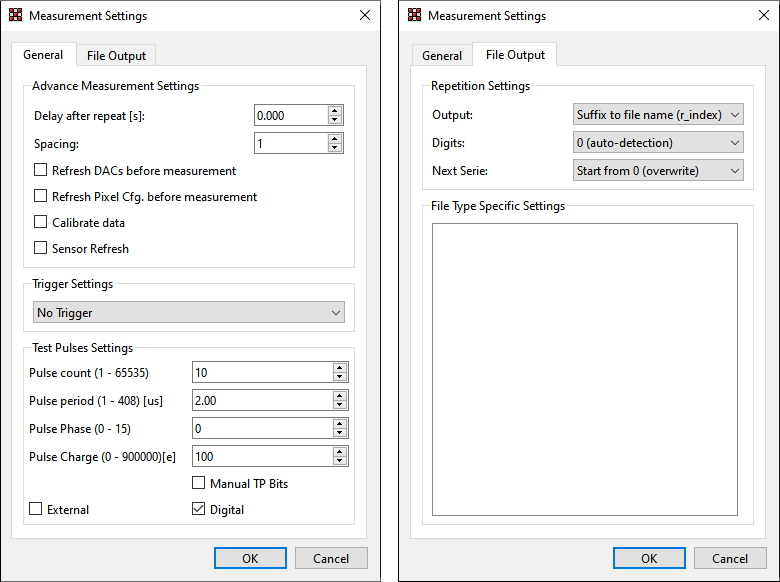
This dialog allows for changing more advance parameters of the measurement such as trigger settings or file output settings. Open in the Measurement panel by clicking the sprocket icon.
General tab
- Delay after repeat: When the number of frames specified in count field in the main window is measurement and the repeat option is enabled, the software waits specified delay before measuring next series of frames.
- Spacing: Influences how many pixels are active during a single acquisition. Because of coupling effects it is necessary to have neighboring pixels masked. If spacing is 1 all pixels are active (acquisition has just 1 sub-acquisition), if spacing is 2 every second pixel in each direction is active (acquisition has 4 sub-acquisition), if spacing is 3 every third pixel in each direction is active (there is 9 sub-acquisitions)
- Refresh DACs Before Measurement: Before the measurement (acquisition series) is started the DAC values are loaded to the detector.
- Refresh Pixel Cfg. Before Measurement: Before the measurement (acquisition series) is started the pixel matrix configuration is loaded into the detector
- Calibrate data: Data are internally calibrated from the raw pixel values into energy values in keV, if the detector supports it.
- Sensor refresh: For CdTe sensors, checking this will refresh sensor before each measurement in order to improve the image quality.
- Time delayed integration (TDI): Mode for imaging of moving objects. Integration takes place while lines moving.
- Trigger Settings: Setups the type of trigger measurement with an external trigger
- No Trigger – no trigger is used
- Started by HW Trigger - the measurement is started when the ext. trigger is activated
- Stopped by HW Trigger – the measurement is stopped when the ext. trigger is activated
- Started & Stopped by HW Trigger – the measurement is started by ext. trigger and also stopped by the trigger
- Started by SW Trigger, Stopped SW Trigger – same as above, but the trigger is generated in software. Mainly for debugging purposes.
- Test pulse settings: Settings of on-chip test setup. A different chips has different sets of settings.
- Pulse Count: Specifies number of test pulses that will be send to the detector during test pulse measurement.
- Pulse Period: Specifies the length (period) of the single test pulse in micro seconds.
- Pulse Height: Specifies the amplitude of the test pulse in volts.
- Pulse Phase: Specifies the phase of the test pulse in binary.
- Pulse Charge: Specifies the charge of the test pulse in electrons.
- Pulse Charge1: Specifies the charge of the test pulse in volts on channel 1.
- Pulse Charge2: Specifies the charge of the test pulse in volts on channel 2.
- Manual TP Bits: If this is unchecked, the test bit and mask bit “chess” pattern (specified by spacing) is generated automatically. If Manual TP Bits is checked, only pixels that are unmasked and with TP bit active will be active in the “chess” pattern.
File output tab
- Repetition - Output: Specifies the naming of output files when repetition is used. Either for each new repetition the suffix r_index is an added to the file name (where index is the index of the repetition) or for each repetition a new directory is created.
- Repetition - Digits: Specifies the number of digits the repetition index has. For e.g. 4 digits, the number looks like this: 0001, 0010, 0234, 1234. Auto detection sets the correct digit count based on number of repetitions.
- File Type Specific Settings: Specific settings for selected file type
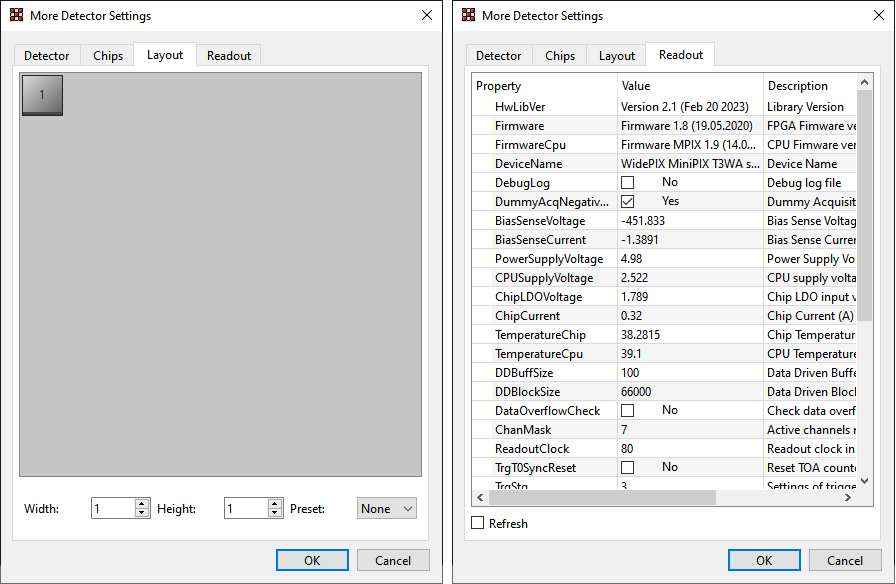
More Detector Settings dialog
This dialog allows for changing more advanced parameters of the detector.
Open this by clicking the "wrench and screwdriver" icon it the Detector settings panel.
Detector tab
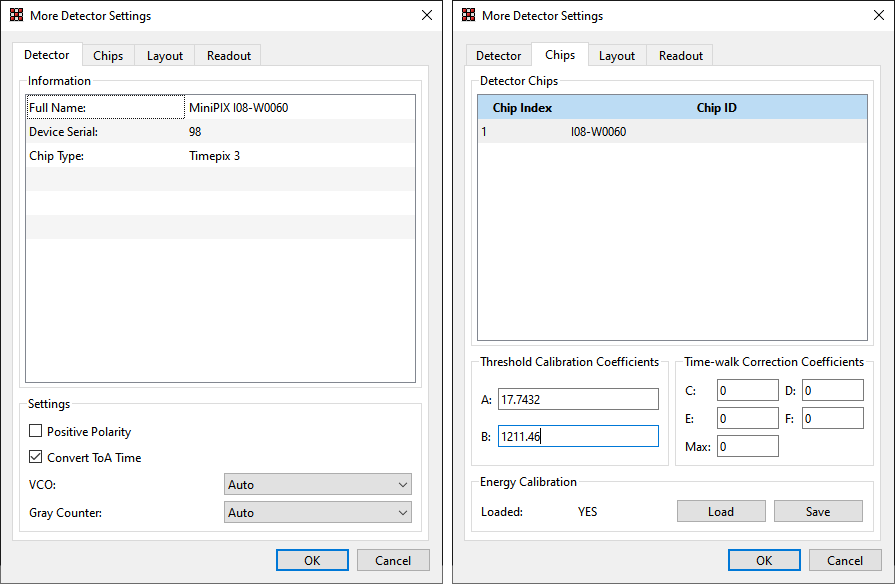
Shows basic information about the connected device. Serial numbers, chip ID number, type of the chip, type of the readout and if the calibration is present. Different types of detectors has different lists of settings.
- Delay after setting DACs: The software will wait specified delay each time the DACs are loaded into detector. This is for the chip to stabilize after the DAC values are changed.
- Positive polarity: Polarity setting of the AFE inputs in the pixels. For testing purposes only. Leave the default value.
- Convert ToA time: Convert ToA value to nanoseconds.
- VCO: Can force ON/OFF VCOs used to measure FToA. For testing purposes only. Leave the value Auto.
- Gray counter: Can force hardware/software gray decoding. For testing purposes only. Leave the value Auto.
- Range (Gain mode): Gain setting of the analog front end in the pixels.
- Continuous Mode: The counters alternate, while one measures a new frame, the other sends an already measured frame. Non-compatible with 2CH mode and with full counter depth.
- Counter: Select which counter to use.
- Counter Depth: Select the bit depth of the counter used.
- Column Block: Select the part of the chip to be used.
- Row Block: Select the part of the chip to be used.
- Disc CSM SPM: Enable/disable CSM/SPM discrimination (See Mpx3 manual).
- Color Mode: Enable/disable color mode (working only with special chips with coupled pixels).
Chip tab
Shows chip IDs, parameters and settings of each chip in the selected device. Different types of detectors has different lists of settings and parameters.
- Positive polarity: Polarity setting of the AFE inputs in the pixels. For testing purposes only. Leave the default value.
- Threshold Calibration Coefficients: Calibration coefitients for converting keVs to digital values for DACs used to set threshold.
- Time-walk Correction Coefficients: Coefficients for correcting the influence of the speed of propagation of charges of different sizes through a thick chip.
- Energy calibration: Indicator if calibration for converting binary ToT value from pixels to energy [keV] is loaded. Load and save/export calibration data.
- Threshold: Select the threshold channel for which the threshold calibration coefficients apply.
- Range (gain): Gain selection for which the threshold calibration coefficients apply.
- Depth: Select the conter depth for which the threshold calibration coefficients apply.
Layout tab
For multiple chip devices the user has a possibility to rearrange the chips so that the image in the software corresponds to physical layout of the device. Chips can be rearranged simply by dragging each chip tile. By right clicking on the chip, it’s orientation can be changed by 90 degrees. The width and height specify the shape of the chip matrix.
Readout tab
Readout tab shows readout device specific parameters. This is device dependent. Ifthere is a parameter that is changing during time (e.g. sensing of voltage, temperature) the refresh checkbox allows for automatic refresh of all the parameters approximately every second.
Set Pixel Configuration dialog
![]()
This dialog allows for changing in detail all the configuration parameters of the pixel or group of pixels in the pixel matrix.
- Region: Selects the region that the selected settings will be applied to
- Full Matrix – all the pixels in the pixel matrix
- Single – just a single pixel
- Row – selected row
- Column – selected column
- Submatrix – selection area (or multiple areas) that were selected before opening this dialog
- X (Column) From, Y (Row) From, ... The user can manually specify the area that the new settings will be applied to
- Pixel Configuration: If the particular bit checkbox is checked the settings on the right side will be applied. If it is unchecked, the settings of this bit will not be changed.
Filter Settings dialogs
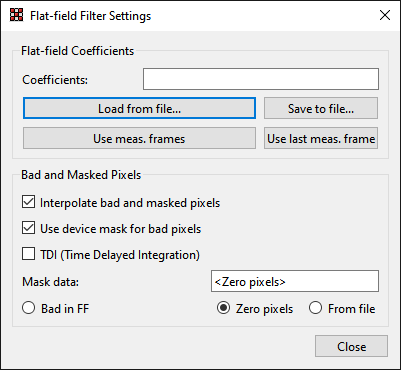
Flat-field Filter Settings dialog
This dialog allows for changing the parameter of the flat-field correction. The Flat-field correction is the simplest method for suppressing image distortion due to pixel efficiency non uniformity. It is based on using a matrix of multiplicative coefficients characterizing the relative efficiency of each pixel to the efficiency of an average pixel. A raw image of an unknown sample can be corrected by multiplication of the measured pixel value and its respective correction coefficient to produce the corrected image.
- Flat-field Coefficients: The correction coefficients can either be loaded from a file (matrix of ASCII numbers), the currently measured frames can be used (they are averaged) or just the latest measured frame. The coefficients can be saved into a file for later usage.
- Bad and Masked Pixels: Sometimes some pixels are not responding correctly or are just simple masked. For these pixels the correction coefficients are not measured. If the checkbox Interpolate bad and masked pixels is checked, those pixels are interpolated from the surrounding pixels. For the software to know what are the bad pixels the user can either load a bad pixel matrix manually from a file, use only the masked pixels that are set in pixel configuration settings or use all the pixels that are counting zero.
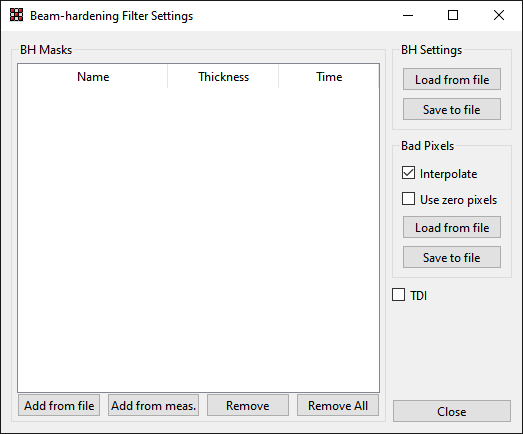
Beam-Hardening Filter Settings dialog
When X-ray beam with continuous energy spectrum is used for transmission radiography the beam hardening effect arises. A thicker i.e. more attenuating parts of the object attenuate softer parts of the original spectrum more effectively then thinner parts. X-ray beam energy spectrum varies from point to point behind an object of non-uniform attenuation. If an efficiency of the sensor pixels is energy dependent (and it is) then this effect leads to distortions making tomographic reconstruction almost impossible. Moreover, if such efficiency dependence is different for individual pixels then even single images are distorted remarkably. Flat field correction can improve the image distorted by non-uniform pixel efficiency but just for certain absorber thickness.
The Beam-Hardening calibration solves this problem for images of objects of different thicknesses. To make proper beam-hardening calibration it is necessary to prepare set of perfectly flat calibrators of different thicknesses covering thickness range of the object to be inspected. The images measured for each of such calibrators serve as calibration masks for the beam hardening calibration.
This dialog allows for changing the parameter of the beam-hardening correction – loading the beam-hardening masks and interpolating bad pixels. On the left side of the window is a list of all the beam-hardening masks. Each mask needs to have the thickness of the calibrator and acquisition time of the measurement specified for the correction to be calculated properly. The mask can be either loaded from file (Add from file) or from currently measured frames (Add from meas.). The whole configuration can be saved or loaded from file. Similarly, as for flat-field correction, some pixels might not work properly, or are just masked. These pixels can be interpolated from surrounding pixels. The user can either load a mask specifying bad pixels from file, or might use the pixels that counts zero.
Plugins
Clustering plugin
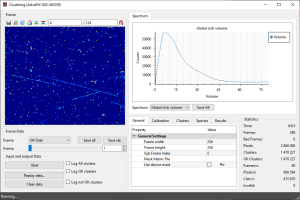
The clustering module performs on-line or off-line identification of the particle traces in images recorded by Pixet, performs their energy calibration, shape analysis and sorting. The module generates various types of results: Histograms, images, 2D maps, logs.
The Clustering tool processes frames provided by preselected device in Pixet. The parameters of the device such as exposure time or triggering are controlled by Pixet. The clustering tool therefore doesn’t control the data taking. Whenever Pixet takes the new frame it is automatically send for processing to the Clustering tool.
The frames being passed to the Clustering tool contain traces of ionizing particles. Each particle track is identified as continuous area of neighboring pixels in the frame. Such set of pixels is called “Cluster”. The tool identifies individual clusters and process them according to preselected criteria. This principle can be used only when traces of particles are not overlaying. Therefore, it is important to set the exposure time short enough keeping low frame occupancy to avoid overlaying of particle traces. There is no universal maximal level of the frame occupancy since it depends significantly on size and shapes of particle traces.
The Clustering tool can evaluate a number of parameters for each identified cluster. User can specify certain acceptance criteria for selected parameters. Typically, the criteria are given as a range of allowed parameter values. Clusters which are positively evaluated are assigned with “OK” flag and they are often referred as “OK clusters” in the software.
Generating of cluster log files The identified clusters can be saved to special output files called “cluster logs”. The cluster log is ASCII file containing many frames. For each of them there is list of clusters. Each cluster is described by single row where a list of pixels belonging to that cluster are listed. Each pixel is described by three numbers “[X,Y,value]” where X,Y are pixel coordinates (integer) and value (double) is the pixel value (usually energy or time). The Cluster log file format is very simple so that these files are often used as an input for further analysis by other software (Matlab or Python scripts ...). Saved Cluster log file can be replayed many times later refining sorting criteria.
Clustering plugin main Window
The main window consists of several panels – the frame, input and output settings, spectrum, parameters and statistics.
Frame panel
This panel visualizes frames generated by the Clustering tool, depending on the selected Frame type. The range of the image can be changed in Min and Max fields or the range can be set automatically to minimal and maximal value in the frame if the Auto range drop down list is selected. The current frame or frames can be saved to disk. Save selected will save the current visible frame (or series of frames depending on selected type). The Save All saves all types of frames.
Frame Data panel
- OK Data: frame generated only from “OK” clusters: clusters that pass the selected criteria.
- Bad Data: frame generated from all the clusters except the OK clusters
- Raw Sum: sum of all the frames
- OK Sum: sum of all the OK Data frames
- Bad Sum: sum of all the Bad Data frames
- Cluster Count: the frame where each pixel corresponding to a cluster center is incremented by one for each OK cluster
- Average Cluster Height: every pixel in this frame contains average cluster maximal cluster value (height) for all clusters with center in this pixel.
- Average Cluster Size: every pixel in this frame contains average cluster size (number of cluster pixels) for all clusters with center in this pixel
- Average Cluster Volume: every pixel in this frame contains average cluster volume (energy) for all clusters with center in this pixel
- Const Height Cluster Count: Per pixel cluster height spectrum. For each cluster height the image of number of such clusters is generated. The height range is defined in parameter group “Spectra” item “Per Pixel Spectra” and its sub-items. The image to be shown is selected by item “Selected Per Pixel Spectra”
- Const Volume Cluster Count: Per pixel cluster volume spectrum. For each cluster volume the image of number of such clusters is generated. The volume range is defined in parameter group “Spectra” item “Per Pixel Spectra” and its sub-items. The image to be shown is selected by item “Selected Per Pixel Spectra”
- Const Volume Size Sum: Auxiliary image for “Const volume avrg cluster size”
- Const Volume Average Size: Maps average cluster size for clusters of the same volume (energy). The volume range is defined in parameter group “Spectra” item “Per Pixel Spectra” and its sub-items. The image to be shown is selected by item “Selected Per Pixel Spectra”.
Input and Output Data panel
This panel allows for starting/stopping the data taking and specifying the data output. The data taking is started/stopped by start/stop button. The replay data button allows for replaying a data already measured and saved to files. It will replay a frame file, T3PA and CLOG* file. Clear data resets all the frames, statistics and spectra.
*CLOG files are in two types by data source channels count:
- Single channel, from old Timepix chips.
- Dual channel, typically from Timepix3 chips.
Both types can be saved as output from the clustering process, but only the single channel can be used as input. Use the T3PA files as input for Timepix3 or frame files from frame-only new devices.
Note: Start, stop and replay cannot resets data, results are additive. You see all data from start of the plugin or last press of the Clear button.
To save the data one of the Log XXX checkboxes has to be checked. Upon clicking on a particular checkbox a file open dialog is opened where the location and name of the output file can be specified. The Log All Clusters option saves all the measured clusters to cluster log file. Log OK clusters or Log Bad Clusters will save only the clusters marked “OK” or the non-ok clusters respectively.
Spectrum single tab
This panel shows many various spectra depending on selected spectrum type:
- Global cluster size: cluster size spectrum for OK clusters (cluster size = number of pixels in the cluster)
- Global cluster volume: cluster volume spectrum for OK clusters (cluster volume = sum of values of all pixels in the cluster = total energy)
- Global cluster height: cluster height spectrum for OK clusters (cluster height = maximal pixel value in the cluster)
- Per clstr size volume: cluster volume spectra shown independently for several cluster sizes.
- Pixel cluster volume: cluster volume spectrum for single specific pixel (in the middle of matrix)
- Cluster count: spectrum of number of clusters in the image
- Save all button: Save all spectras to files.
Parameters tabs
This panel allows for changing the criteria of OK vs. Bad clusters, selecting the calibration matrixes and changing the results settings.
(not actual will be changed)
General
- Frame width, Frame height: width and height of the detector or frame from file
- Sub Frame Index:
- Mask Matrix File: Path to file with bad pixel mask
- Use device mask: Use pixel mask from the device configuration while processing the data.
When the Use device mask switched on, the actual device mask is applied during processing data. This feature is relevant in case of replaying previously measured data, as it allows to process them with new mask. In practice, it can be used for example for selecting ROI (region of interest) or masking of additional pixel that became noisy during the data acquisition, etc. When used during data acquisition directly, this functionality has no influence, because the masked pixels are already switched off and thus send no data.
Calibration
- Calibrate: if the pixel values are calibrated to energy
- Correct Timewalk: The timewalk correction - Correct dependency between charge value and its speed in the chip.
- Use calibration in config: if the calibration in detector config files is used or the separate a, b, c, t files
- Calibration File X: path to calibration matrix file
Clusters
cluster criteria for OK clusters
- Min/Max cluster height: minimal and maximal allowed cluster height
- Min/Max cluster roundness: minimal and maximal roundness of the cluster (0-1)
- Min/Max cluster size: minimal and maximal cluster size (number of pixels in cluster)
- Min/Max cluster volume: minimal and maximal allowed cluster volume (sum of pixel values)
- Min/Max border pixels: minimal and maximal allowed number border pixels
- Min/Max inner pixels: minimal and maximal allowed number of pixel inside the cluster (not the border pixels)
Spectra
- Global Cluster Size
- Size: size of the spectrum
- Step: step/bin of the spectrum
- Global Cluster Volume
- Size: size of the spectrum
- Step: step/bin of the spectrum
- Global Cluster Height
- Size: size of the spectrum
- Step: step/bin of the spectrum
- Global Cluster Size
- Size: size of the spectrum
- Step: step/bin of the spectrum
- Per Cluster Size Volume
- Size: size of the generated spectrum
- Size Count: number of different cluster sizes for this spectrum
- Cluster Count:
- Size: size of the spectrum
- Step: step/bin of the spectrum
- Per Pixel Spectra
- From: start of the spectrum
- To: end of the spectrum
- Step: step/bin of the spectrum
Results
- Spectra
- Generate Per Pixel Spectra: if the per pixel spectra should be generated. When disabled the processing speed is increased.
- Selected Per Pixel Spectra: selected image (bin) from per pixel spectra t* be shown in frame panel
Statistics
This panel shows the statistics of the analysis and measurement
- Time: the total time from the beginning of measurement
- Frames: Number of processed frames
- Bad Frames: Number of invalid frames
- Cluster: total number of processed clusters
- OK Clusters: total number of processed OK clusters
- Frames/s: number of frames per second
- Clstr/s: number of clusters per second
- Invalid: number of invalid clusters
Python scripting plugin
This plugin allows the user to realize complex measurements, integrate the Pixet with external infrastructure or simply just control the Pixet automatically through scripts written in Python programming language.
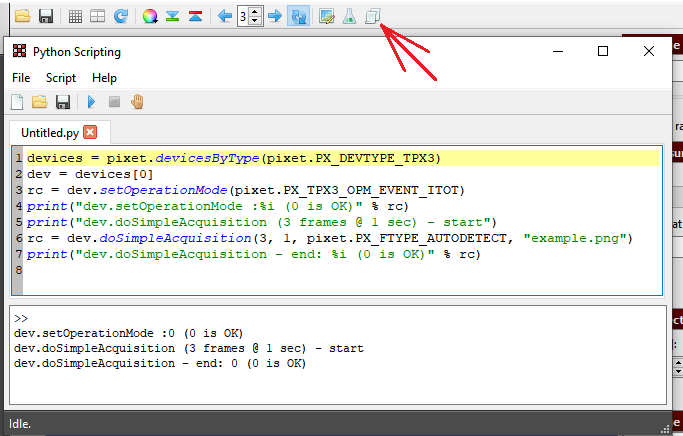
The main window of the plugin contains an editor to write the python code. Several python files can be opened at one time. Each file is represented by a single tab page. The bottom part of the plugin has a python console, where python commands can be run one by one with immediate output. The console also contains the output of executed python script. The script is run by clicking on run button in the toolbar or via Script menu. The execution of the script can be aborted by clicking on the stop button.
The Help -> List Functions opens a window with a list of available objects, functions and constants that form the Pixet API (Application Programming Interface).
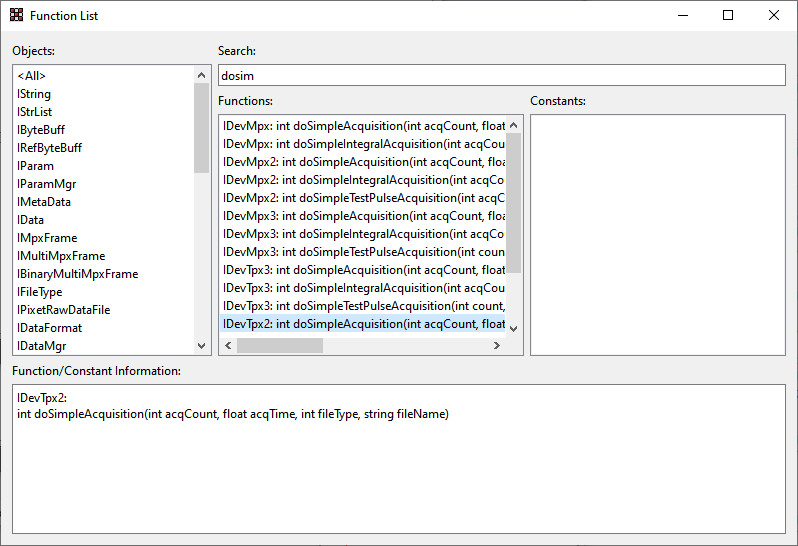
The python scripting embeds a full python 2.7 interpreter including the standard python library. All standard functionality of python should therefore work. It is possible to import all the python modules written purely in python. For more information about Python programming language, please refer to www.python.org or http://www.learnpython.org/.
The Pixet API is accessible to the scripts via pixet variable. This variable represents the IPixet object that contains all the necessary methods to get information about all connected devices, log messages to log file, access the Pixet menu, etc.
Below is the example to get object of the first connected device and measure a single frame and save it to hard disk:
devices = pixet.devicesByType(pixet.PX_DEVTYPE_TPX3)
dev = devices[0]
rc = dev.setOperationMode(pixet.PX_TPX3_OPM_EVENT_ITOT)
print("dev.setOperationMode: %i (0 is OK)" % rc)
print("dev.doSimpleAcquisition (3 frames @ 1 sec) - start")
rc = dev.doSimpleAcquisition(3, 1, pixet.PX_FTYPE_AUTODETECT, "example.png")
print("dev.doSimpleAcquisition - end: %i (0 is OK)" % rc)
For detail about usage of python together with Pixet, please refer to sample scripts in script directory in Pixet directory or list of functions window.
DACs Scans plugin
Note: For factory testing and special scientific purposes only.
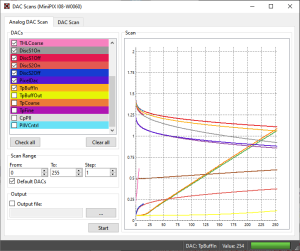
This plugin was designed to measure dependencies between binary input of the DAC and it's physical outputs.
Analog DAC Scan tab
This scan shows the dependency of sensed values on digital codes of DACs inside the readout chip. Check the DACs which you want to scan (you can check/uncheck all with buttons Check all and Clear all), select the range and step in From, To, Step edit boxes and click on Start button. Each DAC which was selected will have its curve in the plot. The curve has same color as the background of the corresponding check box. If you want output to file, check the Output file and specify (or browse with "..." button) filename before starting the scan.
DAC Scan tab
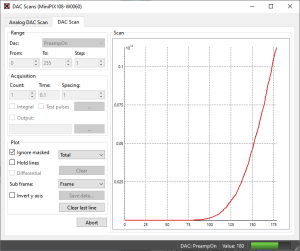
his scan allows to see response of the detector while scanning over a selected range of any Medipix/Timepix DAC. It is useful e.g. for spectroscopic measurement with Medipix2 or for quick scans of THL/THH.
Range frame
- DAC: The DAC that will be scanned.
- From, To, Step: The range that will be scanned from From value to To value with a step Step.
Acquisition frame
- Count: The number of frames that will be measured for a single scan step.
- Time: The acquisition time of each frame in seconds.
- Spacing: Influences how many pixels are active during a single acquisition. Because of coupling effects, it is necessary to have neighboring pixels masked. If spacing is 1 all pixels are active (acquisition has just 1 sub-acquisition), if spacing is 2 every second pixel in each direction is active (acquisition has 4 sub-acquisition), if spacing is 3 every third pixel in each direction is active (there is 9 sub-acquisitions)
- Integral: The frames in a single step will be summed into a one integral frame
- Output: The file name and path where the data from the scan will be saved
- Test pulses: If instead of normal measurement with noise or radiation source, the test pulses are used. The test pulses can be configured by clicking on “…” button.
Plot frame
- Ignore masked: The pixels that are masked will not be calculated in shown plots
- Plot type: Type of the data shown in the plot – Median of all pixel values, Total (sum) of pixel values, Mean (average) of all pixel values
- Hold lines: Holds the previous scan (in plots)
- Differential: If a_1, a_2, ..., a_n are scanned values, the values in plot are 0, a_2-a_1, a_n-a_(n-1)
- Clear: Clears plot and data
- Sub frame: If more complex detectors such as Medipix3 or Timepix3, each pixel can have multiple values. The user can switch between these values by changing this drop down list.
Equalization plugin
Note: For factory testing and special scientific purposes only.
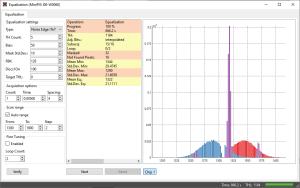
The threshold equalization is a procedure which exploits 3-bits (4-bits for Timepix) local pixel thresholds (THL/THH) adjustment to make overall threshold as homogenous as possible. It finds distribution of thresholds for each adjustment value and selects for each pixel such an adjustment that its threshold is as near as possible to average of means of threshold distributions.
Pixet files and directories
See Files and directories of the Pixet and SDK
PIXet commandline settings
User can run the PIXet program with this commandline options:
- --allow-multiple-instances
- Allow run the PIXet while previous PIXet(s) is running. Useful if next device connected while running measurement on previous PIXet instance.
- --console
- Open the std console and send logs to it.
Related
- PIXet EDU - minimalistic option if the MiniPIX-EDU connected
- PIXet instruction video: https://www.youtube.com/watch?v=wT5lcu3m-OU&t=6s&pp=0gcJCYQJAYcqIYzv
